Aug 23, 2024
From building automation to developing AI Agents, working with headless browsers is a craft that relies on many essential steps:
Building future-proof selectors
Dealing with complex dynamic UI (popups, infinite scroll)
Handling possible network latency or failure
Dodging anti-bot mechanisms
Navigating authentication flows
Each of those steps might require multiple iterations to debug (by adding error handlers and console.log()) along with multiple complete re-runs to validate their proper functioning.
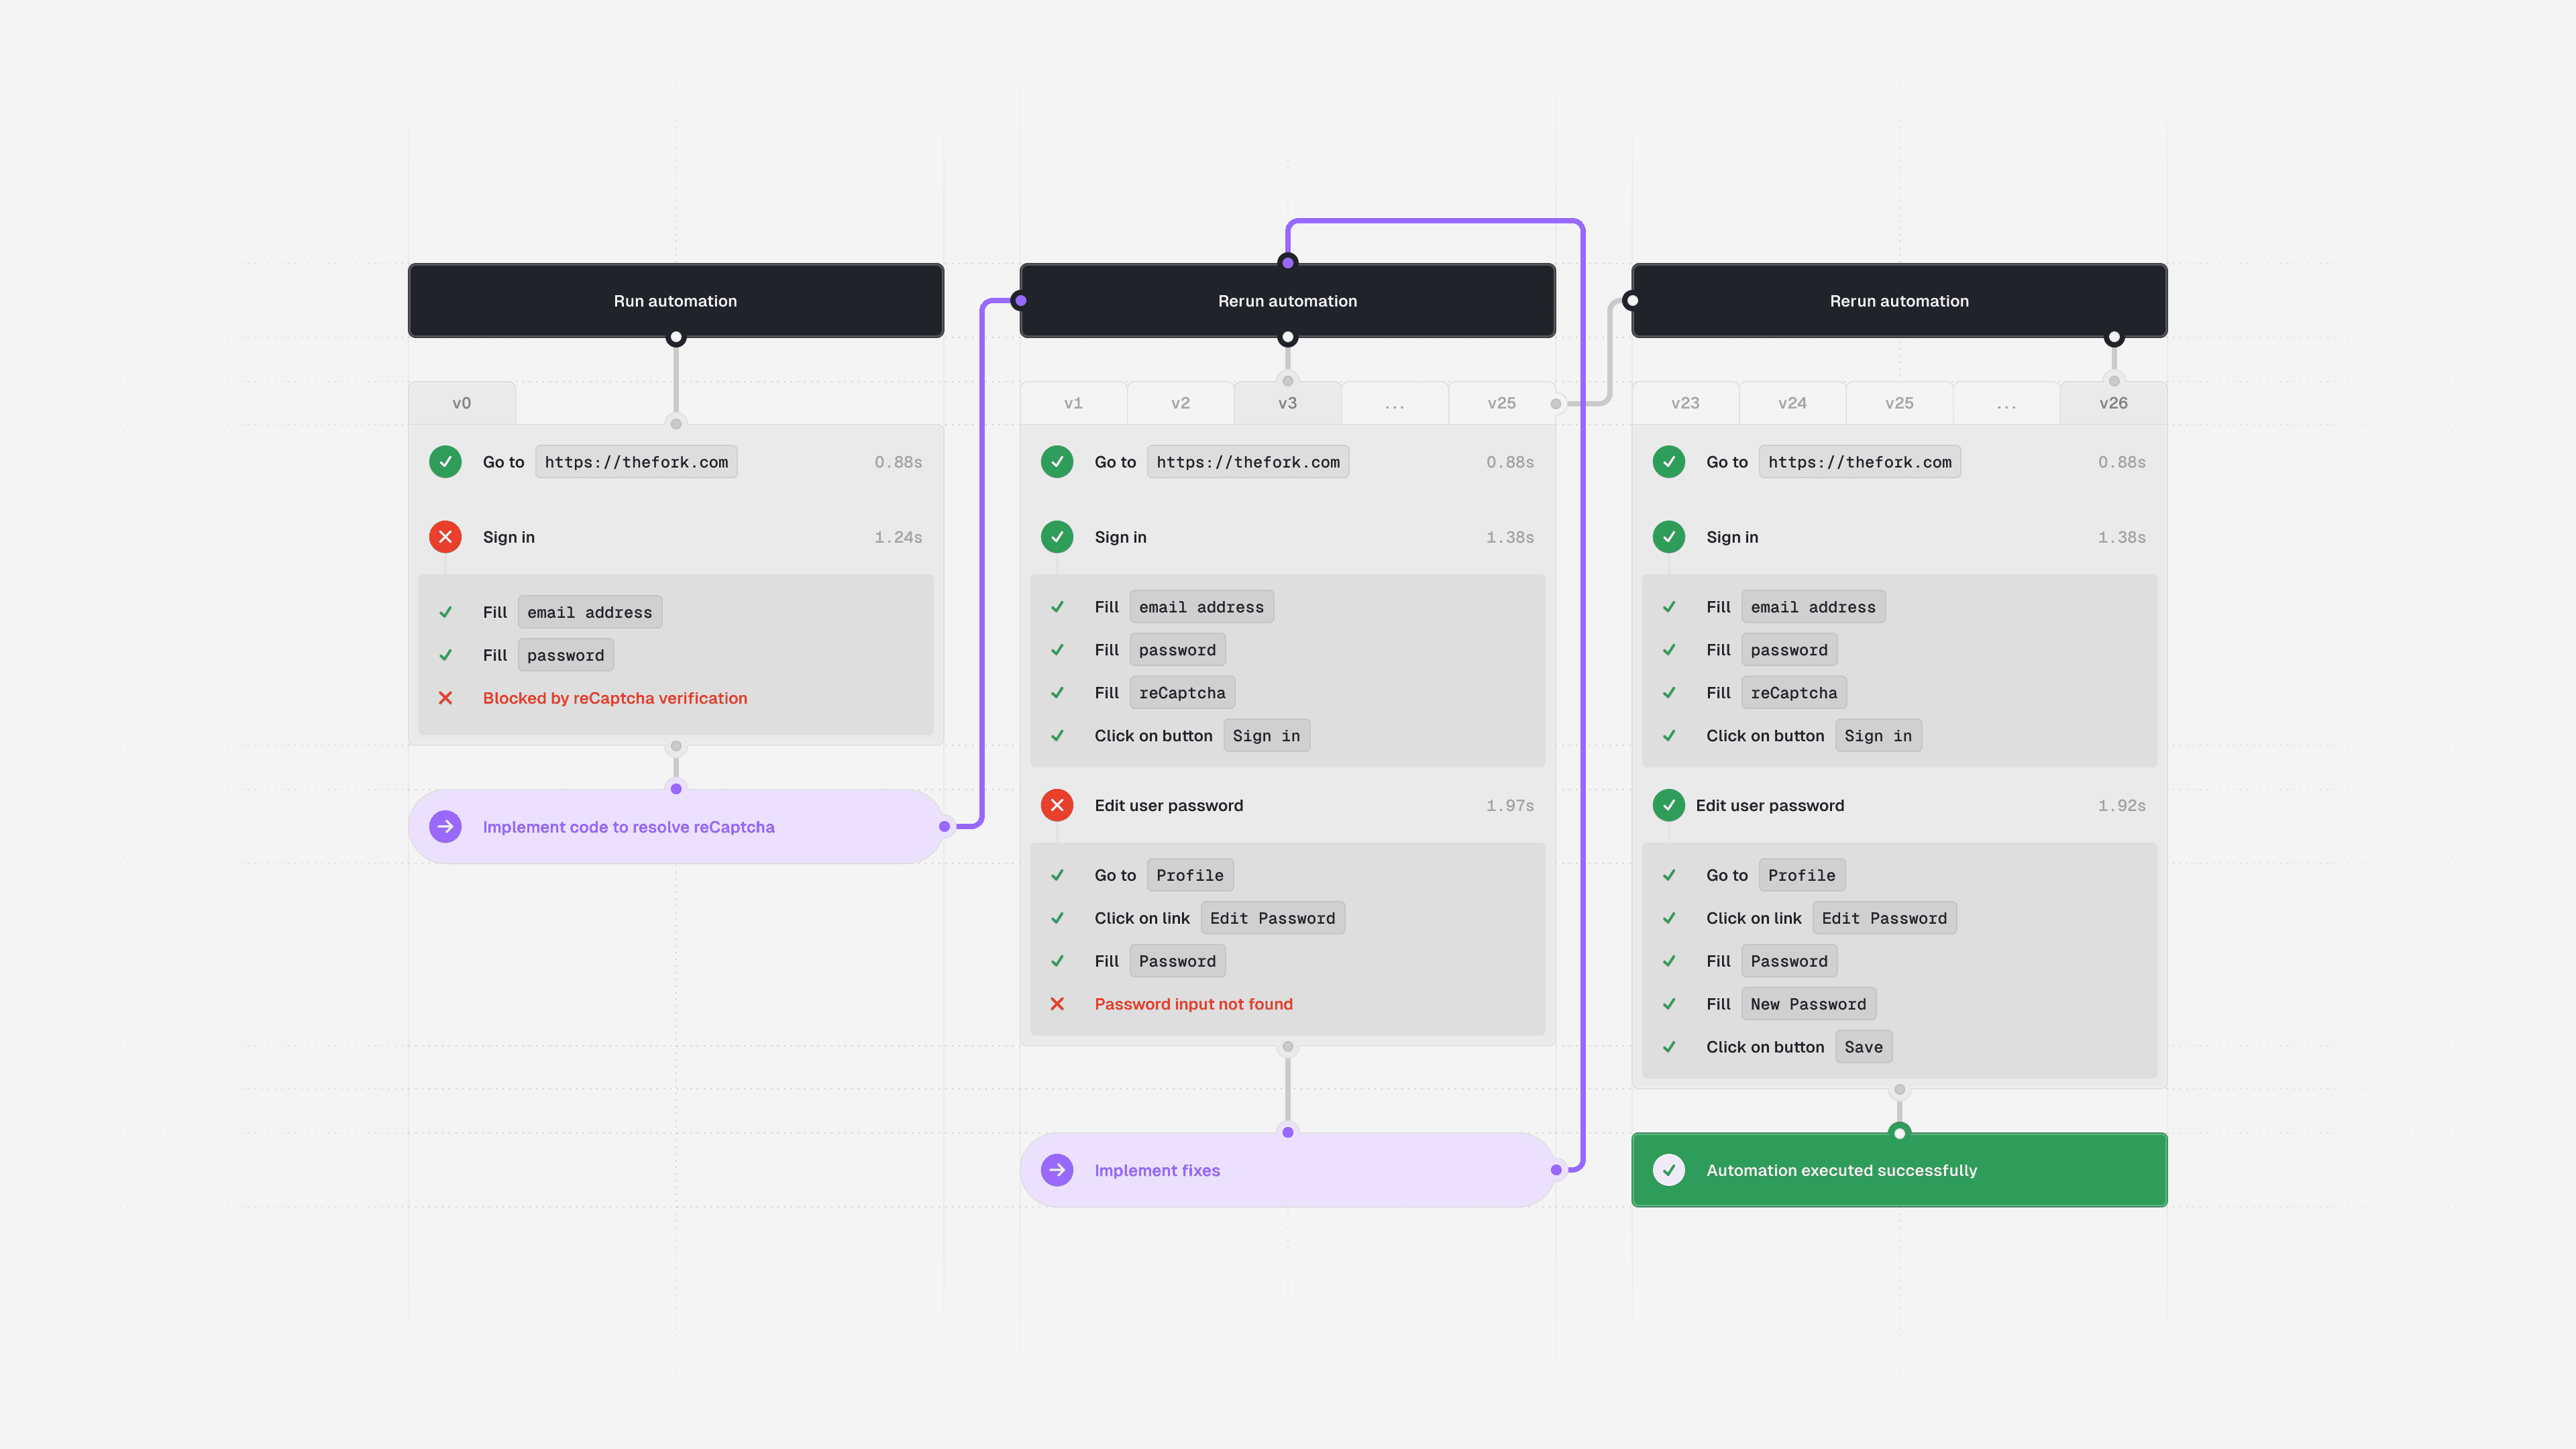
Here is an example of a Password Changer automation development flow running on thefork.com:

The automation faced multiple issues, such as weak selectors that required fine-tuning and a recaptcha that was finally bypassed with a custom-solving logic.
This article will cover how Browserbase, with its Stealth Browser and live Sessions access, helps achieve faster development and avoid discovering issues once deployed.
A Stealth Browser with strong defaults
Dealing with an anti-bot mechanism is one of the most time-consuming parts of developing browser automation. Websites have various tactics, from IP-based filtering to recaptcha or fingerprinting.
Some of them can be avoided by configuring libraries like puppeteer-extra (fingerprinting), while others require custom code (captchas) or can only be discovered once deploying your automation (IP filtering).
By developing and running your automation with Browserbase, you’ll immediately benefit from its custom-built Chromium browsers embedding crucial Stealth features such as:
Automatic Captcha solving
You no longer need custom code or extra dependencies to handle anti-bot issues; change a single line to connect your headless framework to Browserbase:
Let’s now see how Browserbase makes dealing with complex UI and flaky selectors easier.
Live debugging of flaky selectors and complex UIs
Navigating complex UI and authentication flows is the primary goal of Browser automation. Building reliable and quick automation takes time, as many iterations are required to navigate the UI and test selectors.
Browserbase’s Live Session debugging provides live access to running Sessions (for example, when a selector hangs), reducing the number of slow iterations and reruns of the automation:

Here is how to print the Live Session URL to the console as soon as a Session starts with Playwright:
Once your automation starts, you get immediate remote access to the underlying Browser Session running on Browserbase, with the ChromeDev Tools to inspect the page.
In case of failure (for example, a session crash) causing your automation to stop, the URL of the Session Replay grants you access to a full video and logs replay.
Optimizing resources with Session Debugger
Ensuring your automation runs as quickly as possible is essential, but identifying slow resources can be challenging.
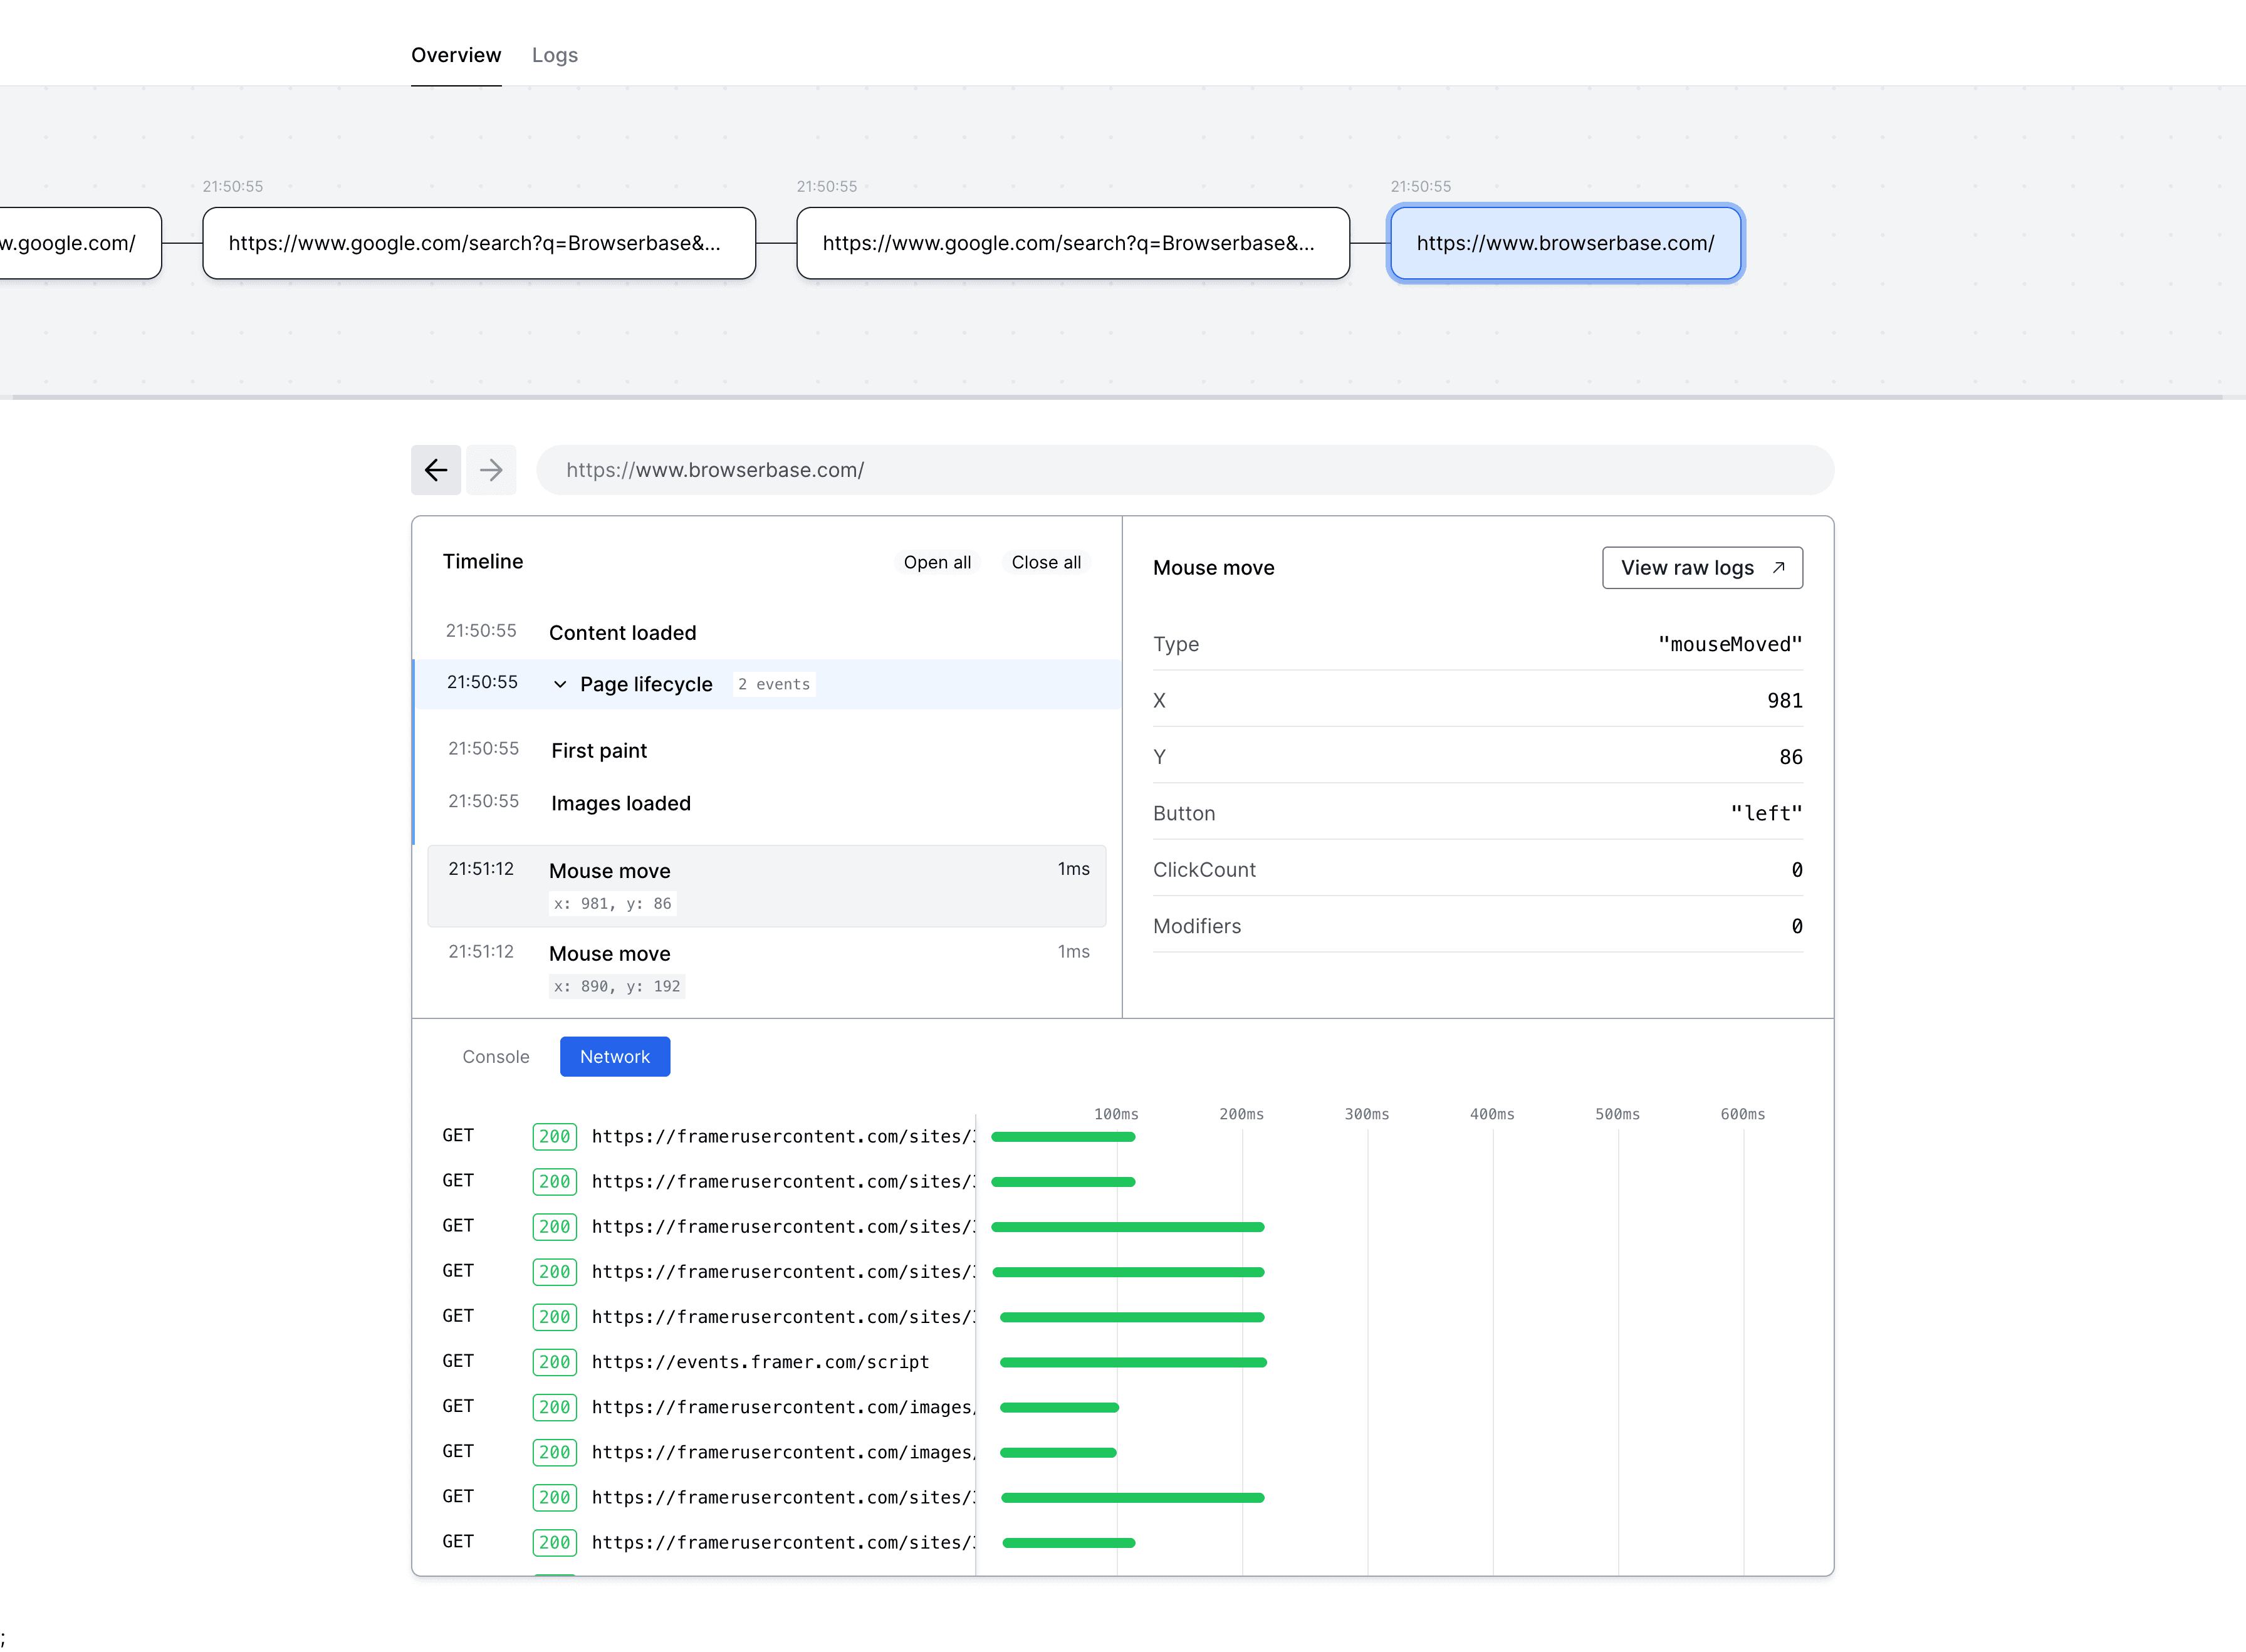
The following snippet shows how to print a Session replay link to get access to the timeline featuring all browser events and resource timings:
Navigating to the printed link, and easily inspect the Session’s network requests:

You can now easily narrow down slow or unnecessary resources and prevent them from slowing down your automation with the Playwright route() API:
Conclusion
Faster browser automation development comes with less code to write, thanks to a Stealth Browser providing automatic captcha solving, proxying, and fingerprinting configuration.
Then, we leverage the Live Session View by reducing the number of iterations to fix selectors or UI navigation.
Finally, optimizing the resources to load for faster automation is achieved with the Chrome Dev Tools timeline view from the Session Debugger.
Give it a try now by starting a Browser Session from the Browserbase Playground.
© 2025 Browserbase. All rights reserved.

