TL;DR CDP is the control surface that gives external programs access to Chromium’s pages, network stack, JavaScript runtime, input system, debugger, and performance instrumentation. This is a beginners guide to CDP.
If you open Chrome and press F12 or opt + cmd + i, a panel appears that can inspect a page, watch every network request, execute JavaScript, emulate a phone, and record a performance trace.
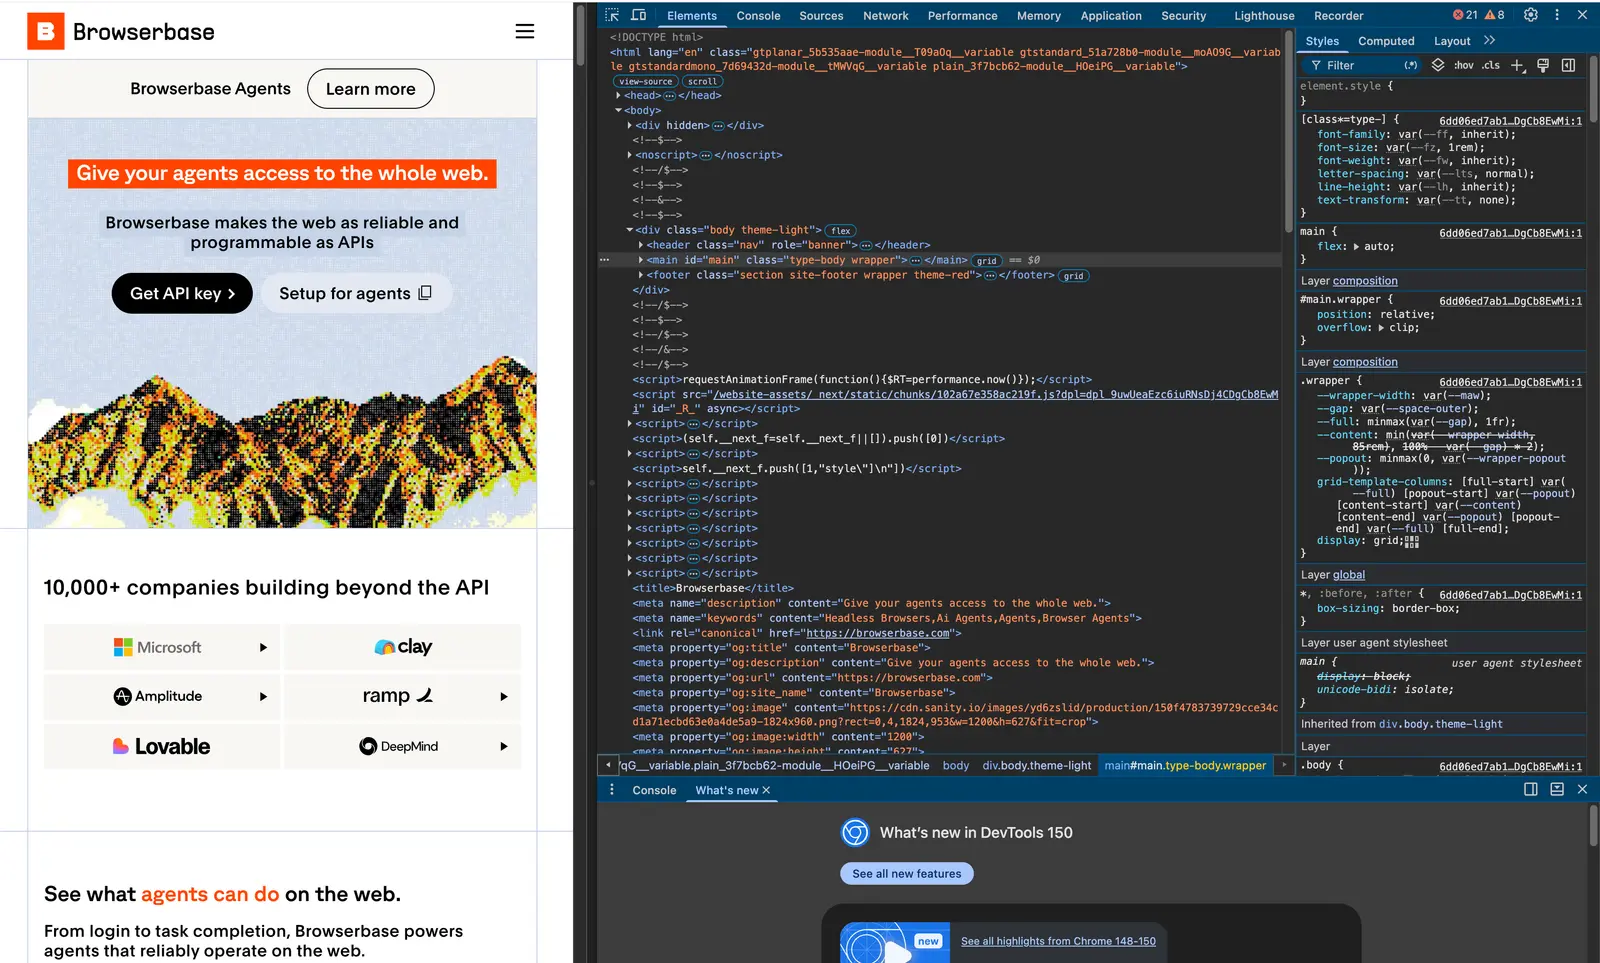
That panel is a separate process talking to the browser, the language between them is Chrome DevTools Protocol, or CDP.
At Browserbase, we’ve learned a lot about the protocol, spending years worth of engineering hours trying to tame it’s imperfections. This is the CDP explainer we wish we had back then.
The protocol behind DevTools
CDP ships in Chromium-based browsers including Chrome, Edge, Brave, Arc, and Opera. DevTools, Lighthouse, Puppeteer, Playwright, and many browser agents use it to talk to the browser. If your code controls Chromium, CDP is somewhere underneath it.
A little history
CDP started as the plumbing behind Chrome’s DevTools, not as a general automation API. When Chrome shipped in 2008, its inspector came from WebKit, the rendering engine Chrome (then) shared with Safari. The DevTools front end needed to run separately from the page it inspected, so the team defined a wire protocol between the front end and the browser.
That WebKit remote debugging protocol became CDP’s ancestor. Then Google split Blink from WebKit in 2013. Chrome’s protocol went with it and became the documented, versioned Chrome DevTools Protocol. Safari continued with the WebKit Inspector Protocol.
Headless Chrome and Puppeteer arrived in 2017. Then eventually Playwright generalized browser automation across Chromium, Firefox, and WebKit.
Talk to Chrome yourself
Launch Chrome with remote debugging enabled and use a temporary profile because modern Chrome restricts remote debugging against the default profile.
Chrome now exposes local discovery endpoints:
The first describes the browser, and the second lists targets you can attach to. A page target includes a webSocketDebuggerUrl, the endpoint for its CDP connection.
Using WS you can create a minimal DevTools client:
It connects to a page, enables lifecycle events, navigates, and waits for Chrome to announce that the page loaded.
The semantics of CDP
CDP uses JSON messages, typically carried over a WebSocket or pipe. The protocol is divided into domains like Page, Network, Runtime, Input, Target, Accessibility, and Tracing.
Each of these domains owns part of the browser.
Pagehandles navigation.Networkobserves requests and responses.Runtimeevaluates JavaScript.Targetdiscovers pages, frames, and workers.Tracingrecords performance data.
A command asks Chrome to do something:
Chrome returns a response with the same ID and the result:
The ID lets a client keep many commands in flight and match each response to its request. Events travel the other way and Chrome emits them whenever browser state changes:
Events have no request ID so to read them you have to enable a domain then consume its event stream.
Sessions and targets
Think of CDP connection as a tree.
The root of this tree is the browser. From there, you discover and attach to targets.
A target is something Chrome can inspect or control, like a page, an out-of-process iframe, a service worker, a shared worker, or an extension page.
Attaching to a target creates a session and commands sent through that session affect that target and its events return through the same session.
Chrome uses Site Isolation to keep pages from different sites in separate renderer processes. When a page embeds a cross-site iframe, Chrome may promote that frame into an out-of-process iframe. It still looks nested inside the page, but CDP may expose it as another target with its own session.
A dedicated worker runs JavaScript away from the page’s main thread, while shared workers and service workers can outlive an individual page. CDP represents these environments as targets or execution contexts so a client can address the right place when it evaluates code or listens for events.
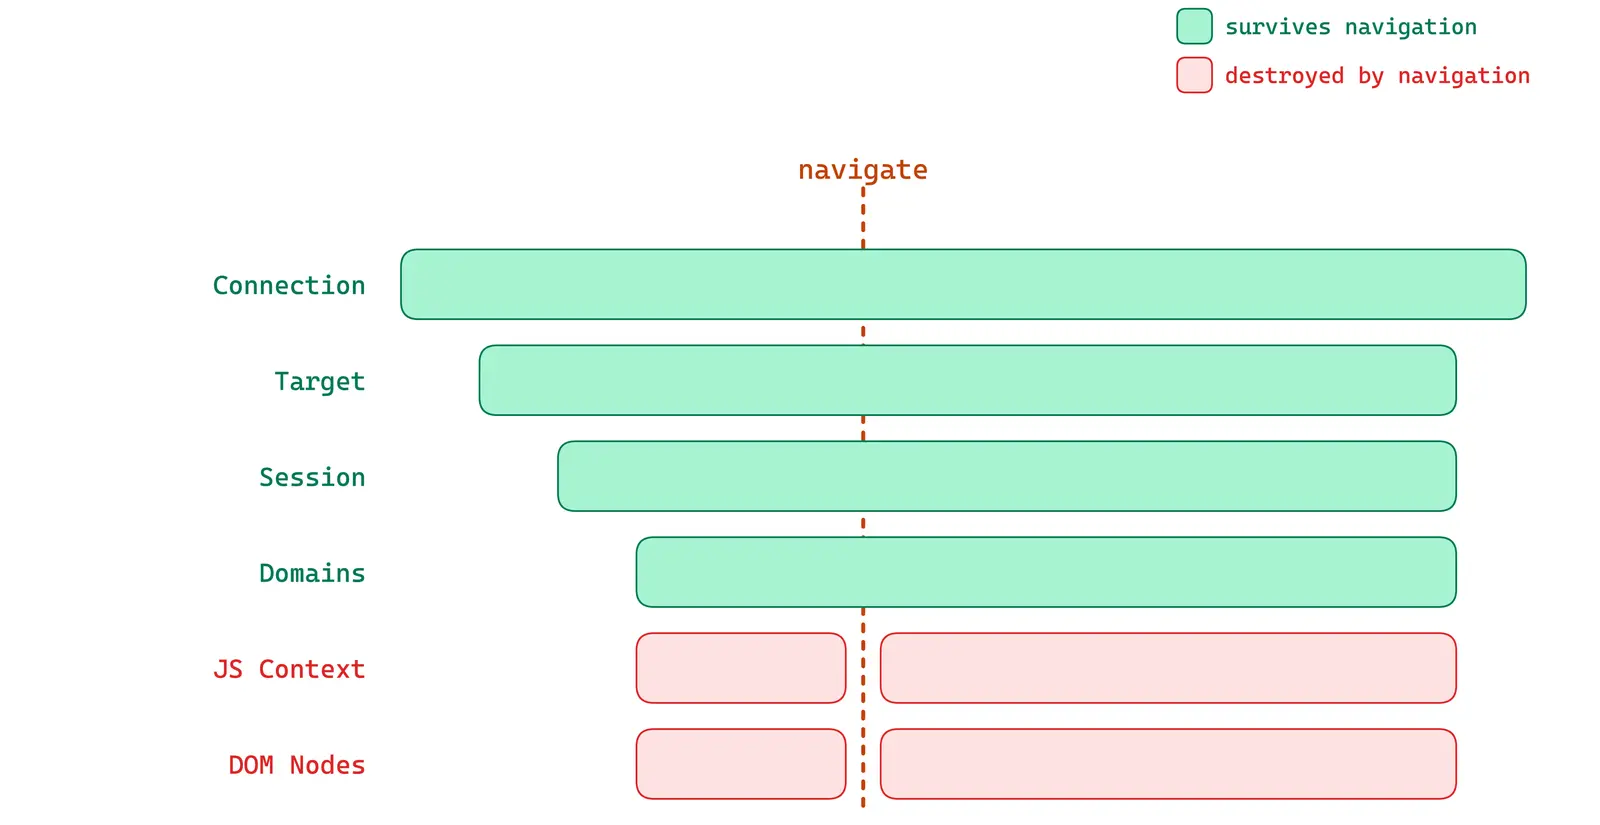
Then, Navigation changes the tree again, loading a new document destroys the frame’s old JavaScript execution context and creates a new one. And any object IDs or references from the previous context become invalid, even when the tab and frame IDs appear unchanged.
A CDP client has to track both structure and lifetime: which targets exist, which sessions are attached, which execution contexts belong to each frame, and when any of them disappear.
You can open a separate CDP connection for every target, but that becomes painful quickly. Flat mode multiplexes them over one single connection and identifies each session with a sessionId. To work properly your client must notice targets, attach at the right time, route messages to the right session, and recover when targets disappear.
What parts of the browser does CDP expose?
CDP talks to the browser from outside the page which gives it a view across way more things: like the renderer, network stack, input system, workers, storage, and debugger.
Network traffic
The Network domain can observe document requests, scripts, images, API calls, redirects, cache hits, and service worker activity.
A request typically passes through Network.requestWillBeSent, Network.responseReceived, and Network.loadingFinished. Those events share IDs, so a client can reconstruct the full lifecycle and then call Network.getResponseBody.
One visible page load may involve several frames, redirects, preflight requests, and hundreds of resources.
JavaScript execution
The Runtime domain evaluates code and reports console calls, exceptions, and execution contexts, which matter because code doesn’t run in one permanent environment. Frames and workers have their own contexts, but navigation destroys them.
Browser input
The Input domain sends mouse, keyboard, touch, and drag events through the browser’s input system.
This is lower-level than calling a JavaScript method on an element. It still doesn’t decide what to click, wait for the layout to settle, or check whether an overlay blocks the target.
Traces and diagnostics
Performance.getMetrics, Tracing.start, console events, exception events, screenshots, and screencasts expose the same things available in DevTools.
A failed browser run carries its own explanation, whether that be a request that stalled, a frame that navigated, the exception that fired, and the trace showing where time went. CDP turns the browser into a fully observable system.
Why executing raw CDP sucks
Wire format is easy, it’s managing state that’s hard.
A raw CDP client has to enable domains before useful events arrive, track targets and execution contexts as navigation creates and destroys them, and coordinate responses and events racing across several domains.
The reference docs explain message shapes, but skip the lifecycle details a real client needs. How long does a session live? What kills it? Does navigation preserve it? Can another WebSocket reuse its sessionId?
A good client has to track targets, sessions, and contexts as they appear and disappear, usually while commands are still in flight. We had to discover these rules ourselves by forcing navigations and crashes, logging every event, and seeing what survived.
Chrome itself also changes (a lot). Stable, experimental, and deprecated methods all coexist in the protocol.
Then there’s policy, CDP can send a mouse event to coordinates, but it can’t decide which element deserves the click or whether the result counts as success.
That’s why libraries such as Playwright and Puppeteer exist, handling waiting, targeting, lifecycle state, and interaction policy while exposing CDP sessions when you need a lower-level capability.
The boundaries of the protocol
CDP belongs to Chromium and Chromium only. Both Firefox and WebKit expose different debugging surfaces (Firefox deprecated CDP in 2024). WebDriver provides a cross-browser automation standard. WebDriver BiDi adds bidirectional events to that model. CDP goes deeper into Chromium because Chromium owns both sides of the protocol.
A debugging connection is also powerful enough to become dangerous. It can inspect pages, execute arb. JS, read network traffic, and control auth’d sessions.
The browser’s control surface
Humans talk to humans using english, programs talk to other programs using protocols, and agents talk to browsers using CDP.
You can navigate a page, watch its requests, execute JS, inspect workers, send input, collect traces, and follow every target through one protocol. I recommend using higher-level tools that make those capabilities easier to use.
You probably shouldn’t build every interaction on raw CDP. But understanding how it works and what the right abstractions are let you make the right decision on how to give your agent access to the web.
→ Kyle
Start building with Browserbase
Run headless browsers for your agents and automations at scale. Get started free in minutes.